


We once existed in the era of trial and error when material had to be physically sacrificed to the cause of experimentation.
Casting process simulation spurred an industry enlightenment. Engineers predict the outcome of their aluminum castings before the molds are even made. The software captures the entire casting process, from the design table, tool engineering and foundry workflow all the way to predict how the casting will perform in the field.


The technology also provides a common communication platform between the designers, foundry and clients so everyone can work together to solve problems and set reasonable projections.
Simulation software drastically reduces the time and expense of developing new casting products or reimagining failed projects. It also removes guesswork from the process, offering confidence and peace of mind.
Eliminate trial and error
People have been casting metal for over 5,000 years, and we’ve known since the mid-1800s how to calculate the physics — heat conduction, fluid dynamics and diffusion — but powerful computers weren’t readily available to crunch the numbers until the 1990s.
Now, many foundries can access simulation software, but a lot of them still don’t take advantage of the technology consistently.
We don’t like conjecture, so engineers perform the entire simulation process before making every mold. It’s far less expensive and much quicker than fixing a mold after its cut in steel.
Metalcasting is a simultaneous interaction between the alloy, mold and process parameters that’s hidden from view within the mold. Simulation tools draw back the curtain to unveil this interplay in detail.
Casting simulations begin with the part design, alloy, and mold material. But there are many other things to consider while evaluating an effective casting simulation model, such as metal temperatures and velocities while filling of the model, air entrapment and inclusions, and possible shrink porosity defects.
Casting Process Simulation Sequence
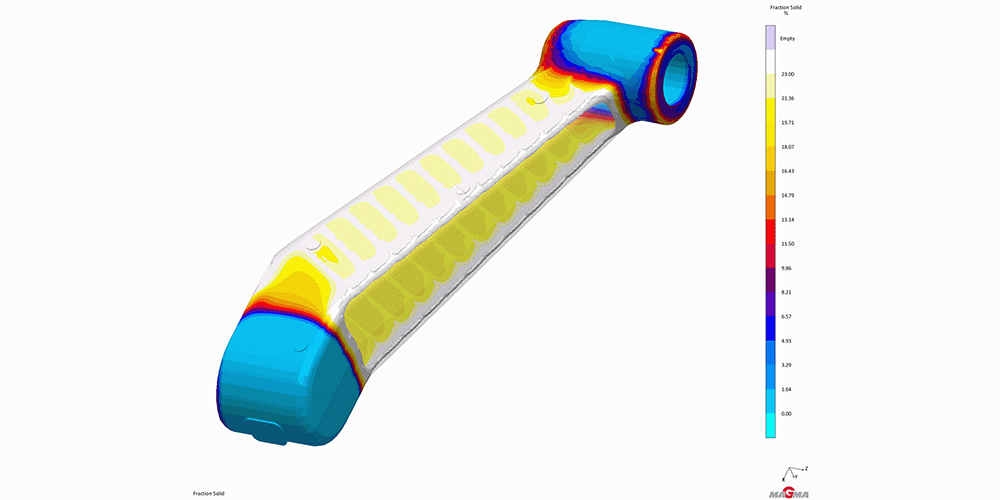
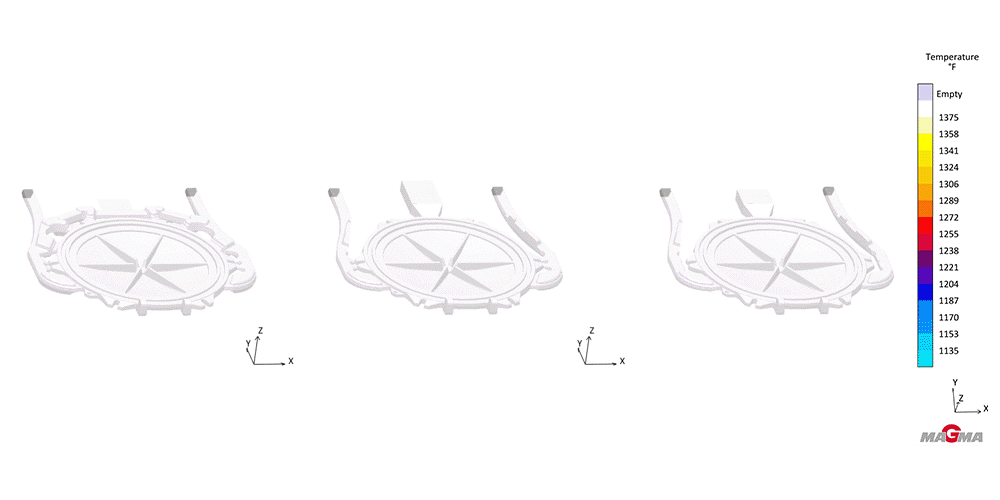
The main component of any effective simulation is a 3D CAD model of the casting, in this case a cast aluminum arm model.
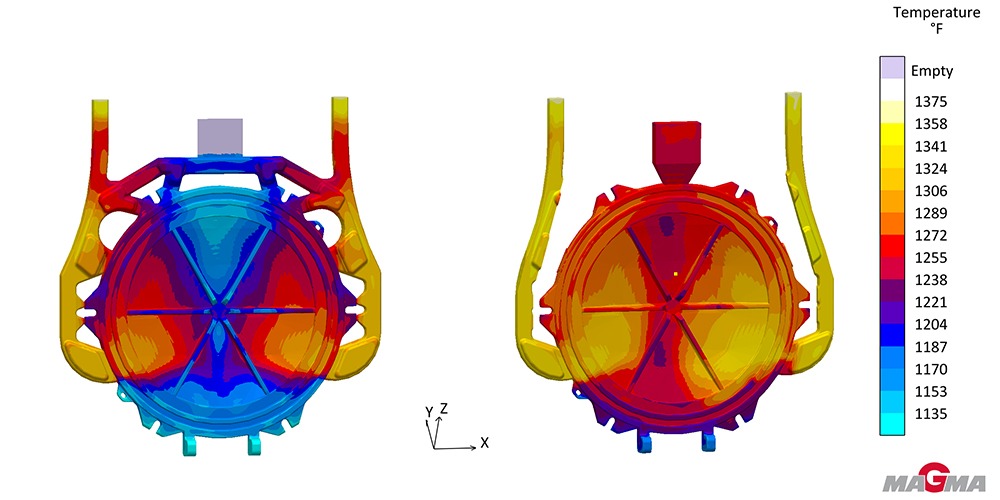
This image from the part’s solidification sequence depicts the metal’s gradual transition from fully molten to a partially and then fully solidified state. The color scale represents varying amounts of liquid metal in different regions of the casting. The transparent regions represent fully solidified structure.
Last-to-solidify areas of the casting, also called hotspots, are the regions in the part that will tend to produce internal shrink voids if not fed with additional metal during solidification.
These defects could jeopardize the product’s structural integrity and lead to part rejects and failures.
Casting designers analyze how the part solidifies and the location of hotspots. They then optimize casting section size and transitions in order to reduce or completely eliminate hotspots.
The foundry process engineers use these simulation results in order to identify effective riser placement and size. Risers (aka feeders) supplement molten alloy to supply metal to the hotspots as it cools.
Material properties
The mechanical properties of cast aluminum alloys are sensitive to composition and the casting process, among other factors. The coarseness of the microstructure and the type of intermetallic compounds that form and precipitate during solidification are fundamental to the material performance. Casting process simulation allows design engineers to predict the resulting microstructure of the casting and its mechanical properties.
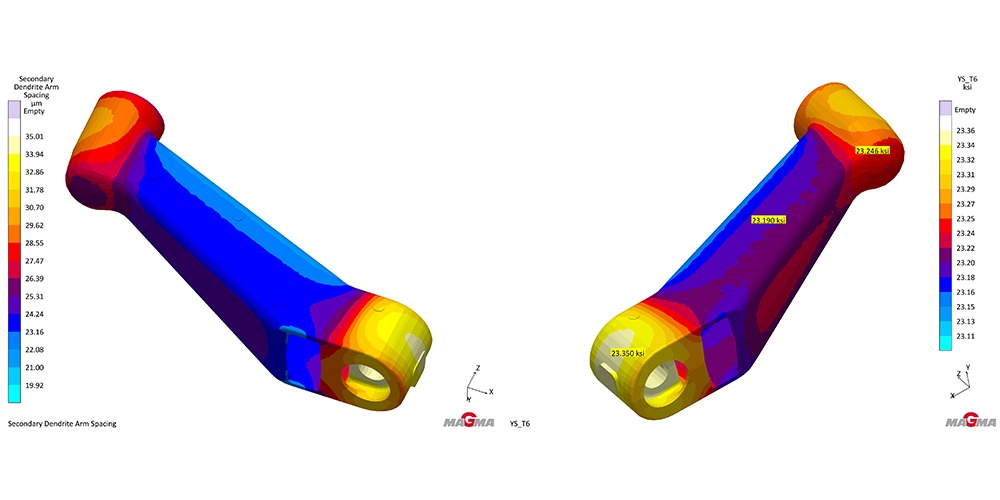
Cast aluminum alloys are characterized by the dendritic morphology of the primary aluminum phase. Visually, these dendrites are akin to tree branches and their size and density are directly related to the solidification rates of the casting structure. The tighter the dendrite arms (branches) are spaced, as characterized by parameters like secondary dendrite arm spacing (SDAS), the stronger the structure.
The SDAS plot on the left, as extracted from simulation results, depicts the distribution of the dendrites at the end of the casting process. Designers can use this information to evaluate the strength and durability of the casting based on its intended application.
Coupling casting properties with performance
The traditional design process assumes material homogeneity throughout the part.
In reality, varying solidification rates change the microstructure, as described above, and cause portions of the casting to exhibit variable mechanical properties. In addition, non-uniform volumetric contraction of the casting can lead to residual stress that may harm part performance under dynamic loading.
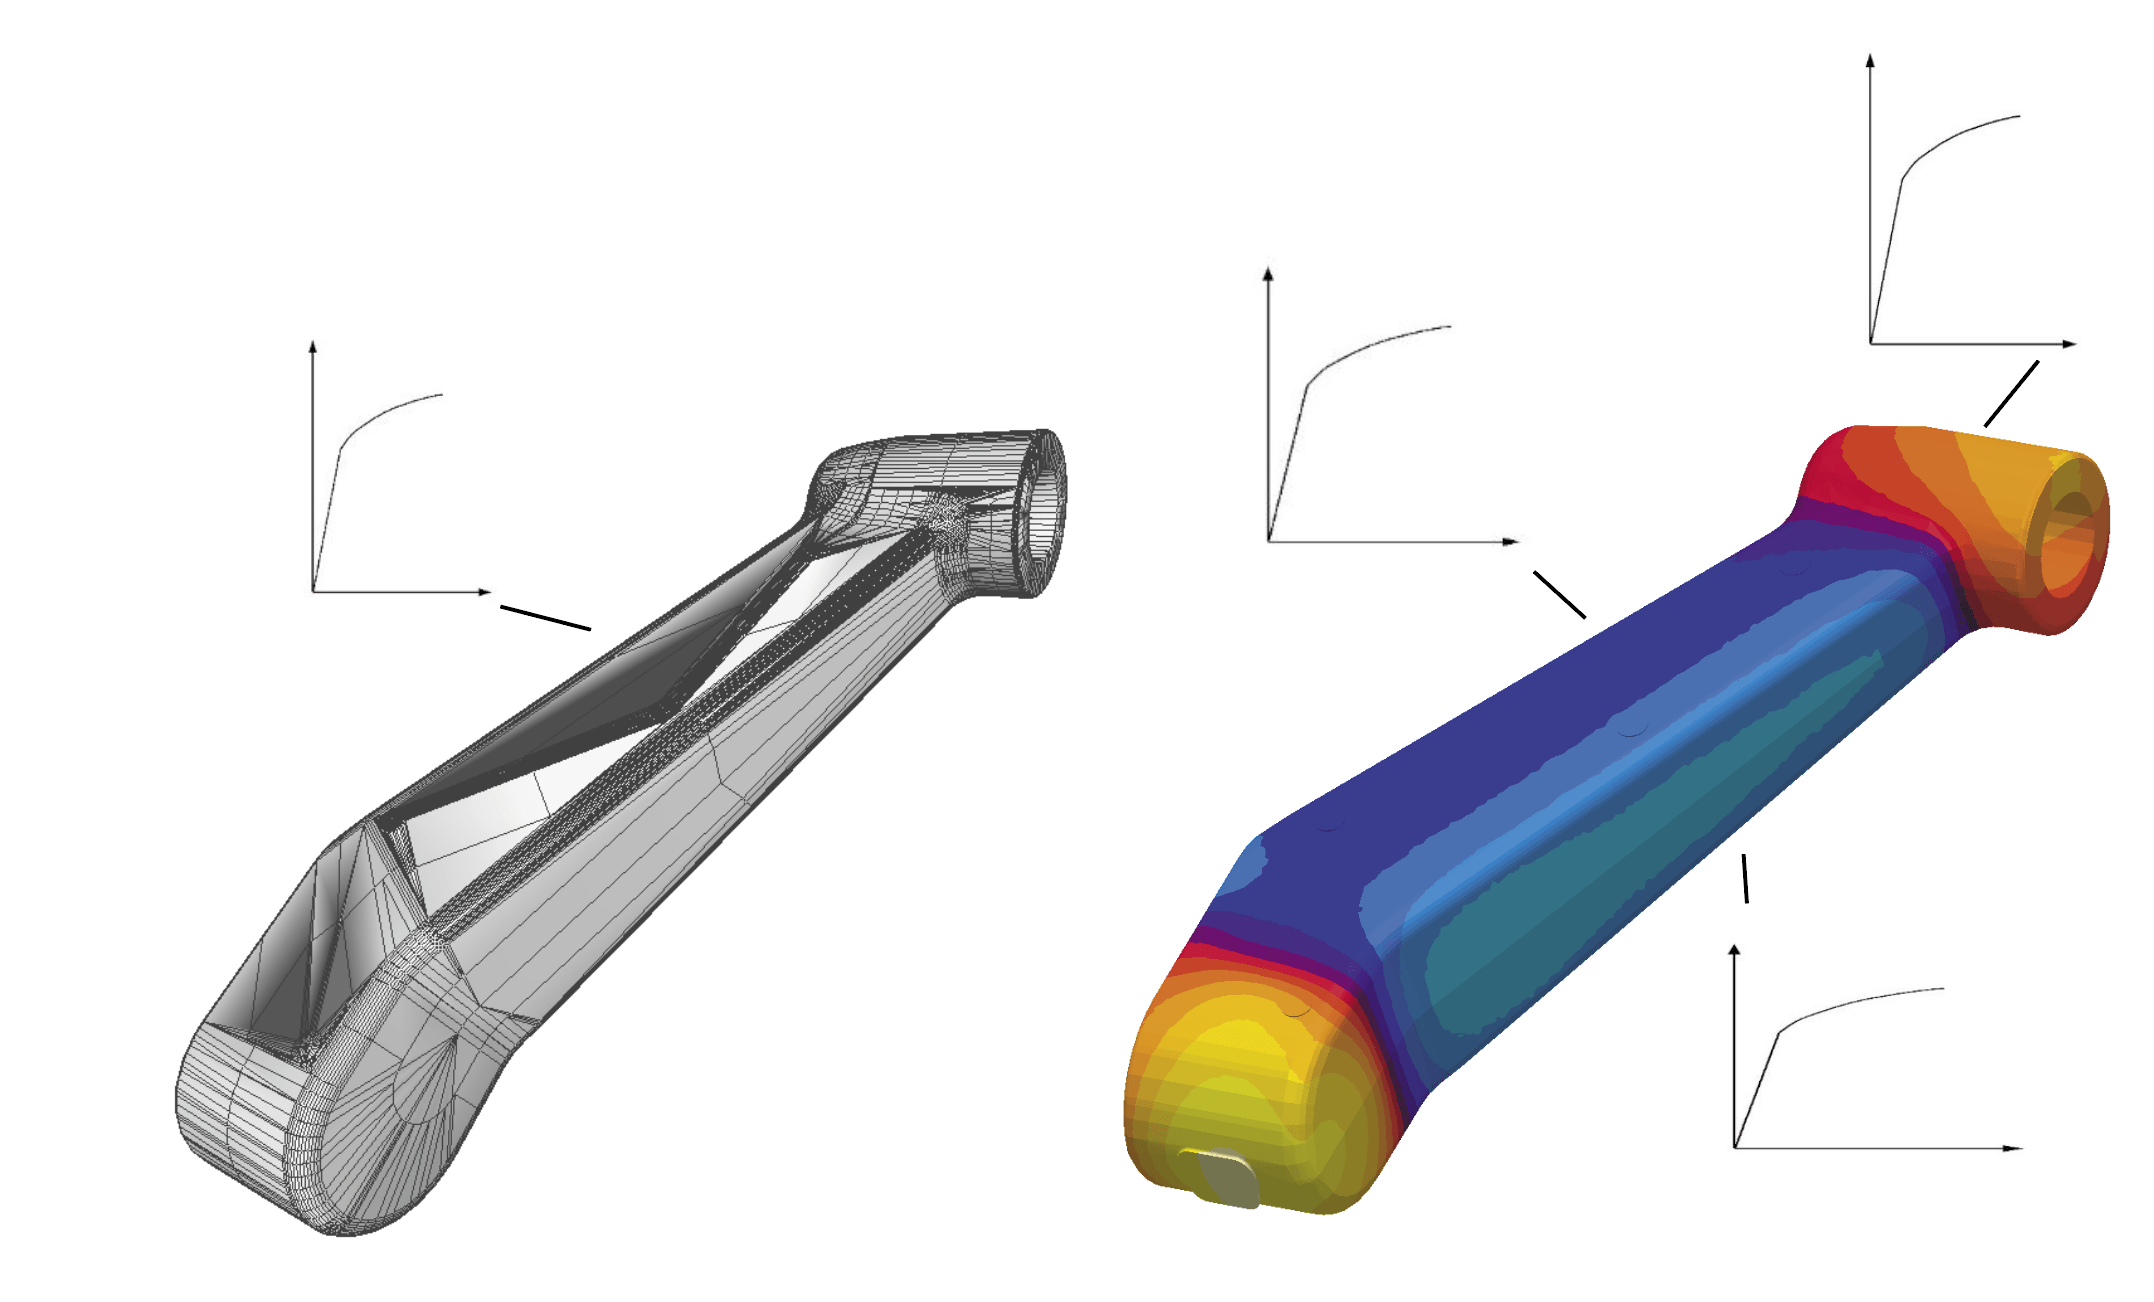
The black and white figure on the left represents the traditional approach, a structural and fatigue analysis model that assumes uniform material properties throughout the entire part. The color-coded figure depicts the various properties that can be predicted from the casting simulation outputs and mapped onto the structural model.
Designers compare this data to the ultimate demands of the product to determine if the part will be able to perform its purpose, such as reliably supporting a specified weight.
If changes need to be made, this is the time to do it.
Tool engineering
Now it’s time to look at things from the perspective of a foundry’s casting process engineer who has to design tooling that can produce optimal castings with as little material waste as possible.
They use the simulation software to evaluate different tooling options and see which combination best optimizes the casting process.
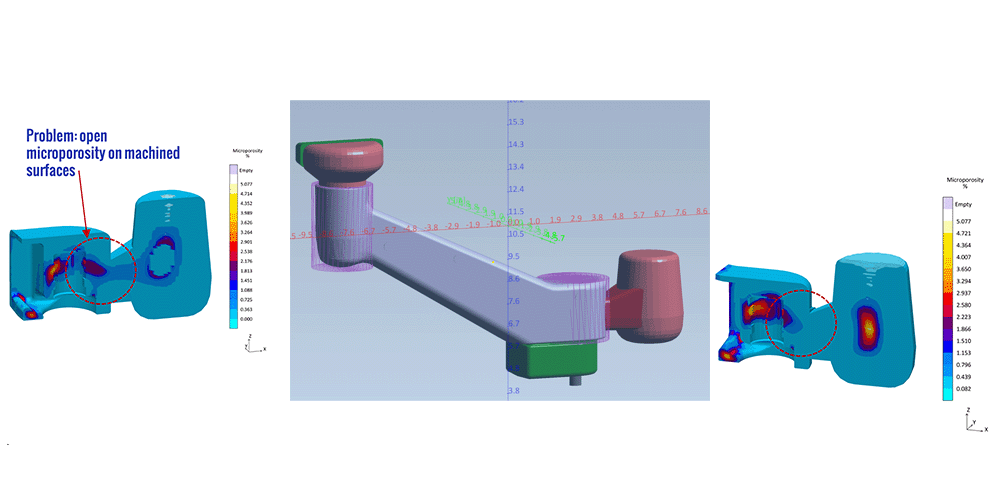
A cross-section on the left shows an area of predicted micro shrink that may open during machining and reduce casting quality and performance.
At center, we see variously sized feeders cycling through the simulation, running the numbers to see how each sizing combination affects the solidification sequence.
The cross-section at right shows that one set of feeders successfully relocated shrinkage away from the more structurally significant portion of the casting.
Fluid flow
Gating systems control the molten metal’s flow into the mold.
Effective simulation models predict how the alloy will fill the mold, distribute heat and solidify with a particular gating system and other tooling.
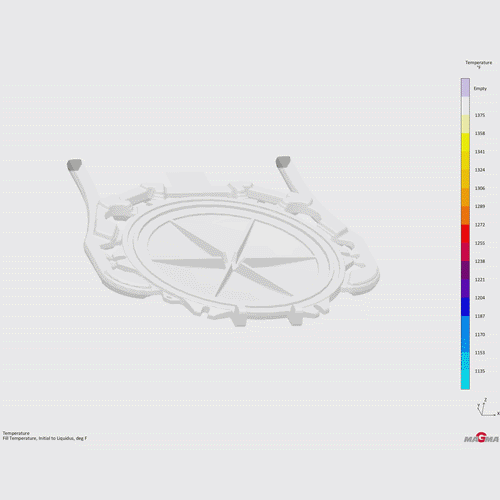
The demo on the left shows how liquid fills the casting starting at about 1,375 degrees Fahrenheit and ending at the liquidus point when it begins to solidify. The upper and lower portions of the castings are cooling at a much faster rate than the sides, which will cause issues in the part.
The demo on the right traces particle flow, which allows engineers to get an inside view of the metal stream as it fills the cavity so they can predict the effects of tooling alterations. Notice how liquid enters the lower gates and escapes through the upper gates, pulling heat back into the gating system and away from the actual part.
Gate graphing
Flow rates are measured for each gating system as represented by this chart. Positive rates represent fluid flowing through the gate to enter the mold, while negative rates indicate liquid leaving the mold through the gate.
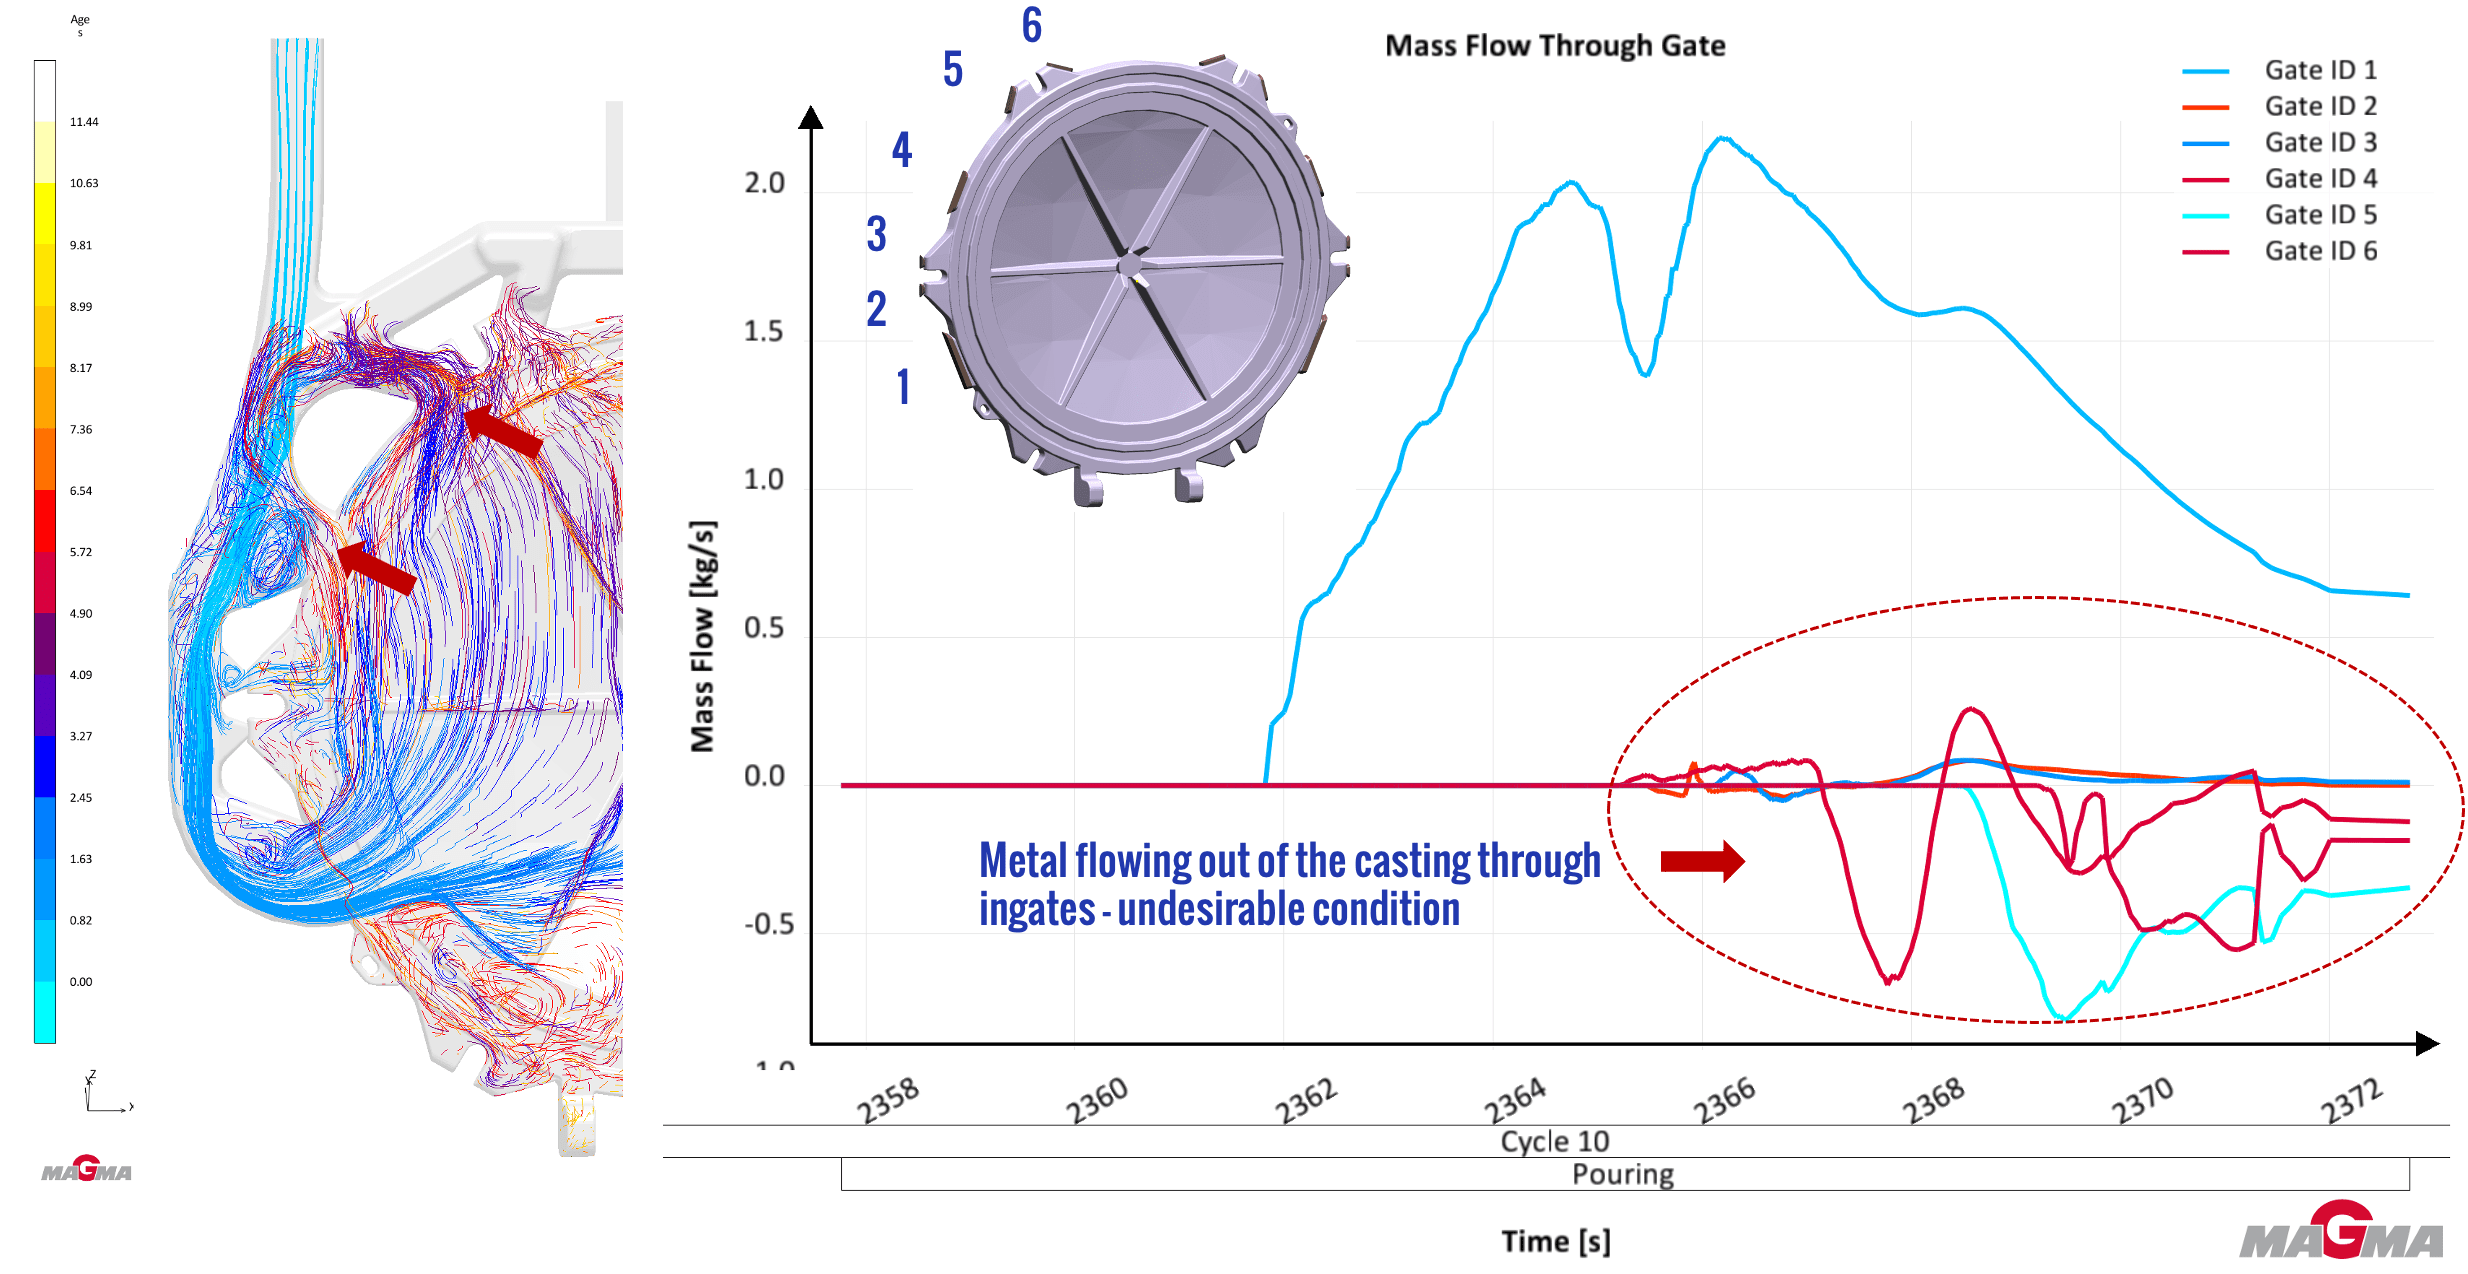
The three gating systems show different improvement options.
Design adjustments
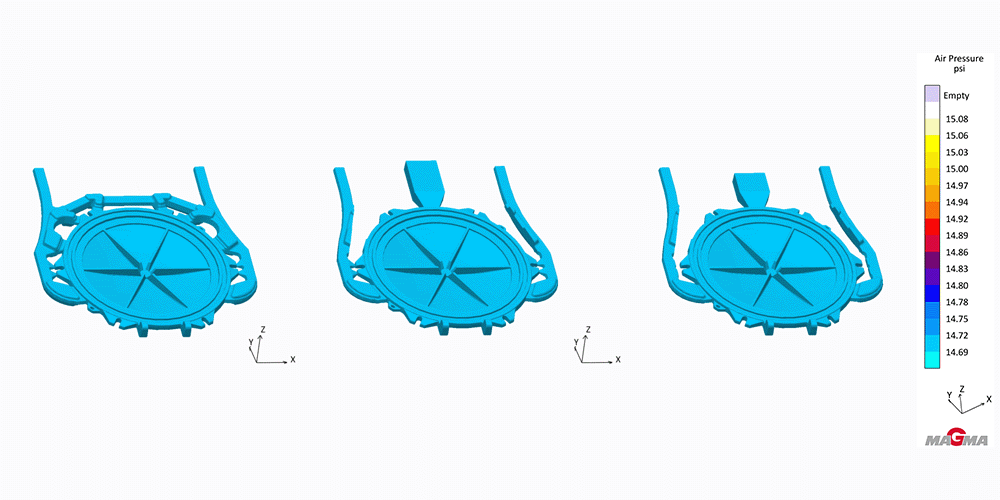
The designer simulates other tooling arrangements in pursuit of better results. In this case, the demo on the left represents the original design, the center shows a mold with only two sets of gates and an upper feeder, and the right shows only the lower gates and upper feeder.
The demo on the right maintained the most consistent fluid temperature and will likely create the densest casting. It also uses the least amount of metal, so it will run faster with a cheaper piece price.
Here these same arrangements are analyzed for air pressure as the mold is filled. The colored alterations in the ingate system indicate gases are escaping against the fluid flow, which should be monitored for non-fill.
The demo on the left shows the risk of trapping air in the casting without an upper riser allowing gases to escape. The other two designs allow air to completely evacuate.
Better, cheaper castings
Fewer ingates also saves money on materials. Excess metal within the gating system is cut away during secondary machining. Our new design demonstrates the two verse six ingate design is more efficient.
Based on these simulations, the foundry could save $4.56 per part by implementing the design on the right over the initial design while producing better castings.
If you’d like to cast stronger, cheaper parts without wasting an ounce of metal, give us a call.
It’s never too early to begin working with our engineers. The earlier you contact us, the more we can provide.
You can reach out for help with ongoing or previously failed projects, and we’ll help you get back on track.
So don’t deal with uncertainty. Move all of your trial and error into the digital realm, saving time, labor and material. That means more money in your pocket and better castings right out of the mold.
We’d like to thank the team at MAGMA Foundry Technologies for their contributions to this article. If you’d like to see how casting simulation can work within a permanent mold process, get in touch with a member of our team. We regularly advise companies on how to optimize a part design.
Subscribe to learn more about permanent mold casting, such as our industry webinars and other content that will help you navigate the world of metalcasting.
"*" indicates required fields

 Guides